

You know, when the two big tech names come together in the AI space, it means a revolution in the making. That is exactly what happened when GitHub and OpenAI came together to build a developer’s dream tool.
GitHub Copilot was designed to help you write code with near-instant results, freeing you up for strategy, execution, and so on. Read along as we look deeper into this clever piece of AI, but with numbers. We will look into adoption, productivity, and the overall revenue situation for this all-in-one coding genius. 🫢
GitHub Copilot by the Numbers: Quick Stats for 2026
These days, every casual conversation will always have a 5 to 10-minute segment dedicated to AI and AI coding tools. And to be honest, you can’t blame anyone either. The progress has been phenomenal. Now, if you look at the numbers for the tool like GitHub Copilot, you will forever agree more. Here’s a quick look:
- At this point, more than 50,000 organizations use GitHub Copilot.
- GitHub Copilot has reached 20 million cumulative users worldwide.
- GitHub Copilot holds 42% market share among paid AI coding tools.
- The tool is currently used by 90% of Fortune 100 companies.
- It generates 46% of the code written by its users on average.
- Java developers report code generation rates of up to 61% with Copilot.
- Developers complete coding tasks 55% faster when using GitHub Copilot.
- GitHub Copilot holds an estimated 42% share of the AI coding assistant market.
- 95% of users say GitHub Copilot makes coding more enjoyable.
- Interestingly enough, Microsoft says GitHub Copilot has become a larger business than GitHub was at the time of Microsoft's 2018 acquisition.
Source:
GitHub Copilot User Growth Statistics
The growth numbers for GitHub Copilot, especially for a SaaS setup, are something that we usually call abnormal. Yahoo Finance reports that one out of every four GitHub Copilot users joined in a span of three months.
Now one can only imagine the impact. Going from 15 million to 20 million means the user base grew by roughly 33% in a single quarter, which is massive for a product that was already at scale. Let us now dive in and understand this setup as a whole. Here’s a quick look at the numbers:
GitHub Copilot Paid Subscriber Statistics
To determine if an app is worthy of the hype, there is a hack. You look into the paid subscription numbers. Think about it this way, it is only good if the people are willing to spend from their own pockets. Here’s a quick detail of the same for GitHub Copilot.
- GitHub Copilot had 1.8 million paid subscribers in 2024.
- The tool had reached 4.7 million paid subscribers by January 2026.
- In fact, to put things in perspective, the paid subscribers grew by 75% year over year in January 2026.
- Copilot Pro+ subscriptions grew by 77% quarter over quarter.
- Most importantly, the platform gained 1.3 million paid subscribers by Q1 2025.
GitHub Copilot Developer Adoption Statistics
Next comes another important aspect of validation. The developer adoption statistics. In other words, do the big companies and the tech people think it’s a great investment? Considering there are hundreds of apps out there in the market?
Studies suggest that about 51% of professional developers use AI tools daily. Secondly, around 84% of developers use or plan to use AI coding tools. Therefore, for GitHub Copilot to make this list automatically means they are doing something right. Here are the numbers:
- Around 40% of developers have tried GitHub Copilot.
- About 26% of developers use GitHub Copilot regularly.
- More than 50% of developers who try Copilot continue using it long term.
- 81.4% of developers install Copilot on the same day they get access.
- 96% of users accept at least one Copilot suggestion on the same day.
- More than 80% of developers successfully adopt GitHub Copilot in enterprise deployments.
- The best part in all this is that around 67% of users engage with GitHub Copilot at least five days per week.
How Quickly Developers Start Using GitHub Copilot
Getting a license is sometimes a part of corporate red tape. The actual numbers are the one that highlight how quickly it changed the entire workflow. Here’s a quick look:
- To begin with, GitHub Copilot maintains an 80% license utilization rate.
- 81.4% of developers install GitHub Copilot on the same day they receive access.
- 96% of developers start accepting Copilot suggestions on the same day.
- The average time from first suggestion to acceptance is 1 minute.
But you also have to keep one thing in mind: developers typically become fully productive with AI coding tools after about 11 weeks.
GitHub Copilot Productivity Statistics
After the paid subscriptions, the license, and the workflow comes the actual question. Is using GitHub Copilot a wise decision? Does it actually help? What do the numbers say? Here’s a detailed look at the numbers:
55% Faster Coding
- Developers completed coding tasks 55% faster with GitHub Copilot.
- Developers using Copilot completed a coding task in 1 hour and 11 minutes.
- Developers without Copilot needed 2 hours and 41 minutes to finish the same task.
Improved Developer Workflow
- 88% of developers reported faster task completion.
- 96% of developers said repetitive coding tasks were completed faster.
- 73% of developers said Copilot helped them stay in a flow state longer.
Faster Software Delivery
- Pull request time dropped from 9.6 days to 2.4 days.
- Teams merged pull requests 50% faster after adopting Copilot.
- Development lead time decreased by 55%.
- Pull requests per developer increased by 8.69%.
- Pull request merge rates improved by 11%.
Higher Engineering Output
- Successful builds increased by 84%.
- Code review speed improved by 15%.
GitHub Copilot Code Generation Statistics
- GitHub Copilot generates 46% of the code written by its users.
- In 2022, GitHub Copilot generated 27% of user code.
- Java developers report code generation rates of up to 61%.
- Python projects see up to 40% Copilot generated code.
- JavaScript and TypeScript projects see 30% to 35% Copilot generated code.
- GitHub Copilot has an average suggestion acceptance rate of 30%.
- Developers keep 88% of accepted Copilot code in final submissions.
- Developers receive an average of 312 code completions per day.
- 90% of developers have committed Copilot-generated code to repositories.
- 91% of developers have merged pull requests containing Copilot-generated code.
GitHub Copilot Code Acceptance Statistics
If you are looking at the numbers, understanding how well GitHub Copilot syncs with the workflow is important. Is the hype really worth it or just an easy access? Research found developers accept between 21.2% and 23.5% of Copilot suggestions on average. Here's a quick look at what the acceptance statistics looks like:
- Less experienced developers accept Copilot suggestions at a rate of 31.9%.
- Experienced developers show a lower acceptance rate of only 26.2%.
- Whereas Developers with high usage accept approximately 29.73% of suggestions.
- Medium users accept around 22% of suggestions.
- Light users accept only 11% of suggestions.
Quick Fact: At this point, more than 50,000 organizations use GitHub Copilot. It had reported 77,000 enterprise customers in FY2024.
- Enterprise customer growth reached 75% quarter over quarter in Q2 2025.
- Siemens deployed GitHub Copilot to 30,000 developers.
- Accenture planned a rollout to 50,000 developers.
GitHub Copilot Revenue Statistics
GitHub Copilot became a larger business than GitHub was at the time Microsoft acquired it in 2018. In other words, the venture brought in not only ease of access or productivity but also revenue. Currently, GitHub's overall annual revenue is estimated at around $2 billion.
- GitHub revenue grew 40% year over year due to Copilot adoption.
- It holds 42% of the paid AI coding tools market.
- GitHub Copilot is approaching $1 billion in annual recurring revenue.
- Estimated Copilot ARR ranges from $451 million to $848 million based on subscriber and pricing data.
GitHub Copilot Enterprise ROI Statistics
- Organizations typically achieve ROI within 3 to 6 months of deployment.
- GitHub Copilot maintains an 80% license utilization rate in enterprise teams.
- Accenture reported an 8.69% increase in pull requests after deployment.
- Development lead time fell by 55% in enterprise environments.
- Teams merged pull requests 50% faster after adopting GitHub Copilot.
- Pull request volume increased by 70% in some enterprise deployments.
GitHub Copilot Developer Satisfaction Statistics
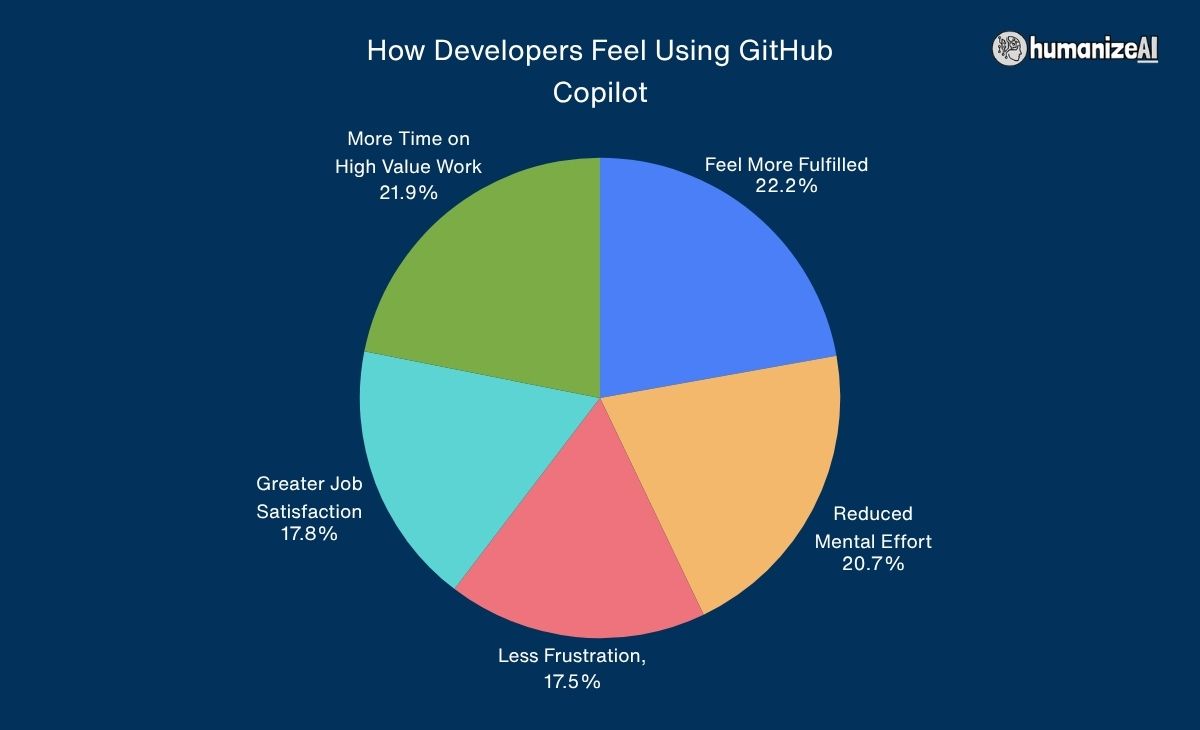
The success of GitHub lies in one simple fact: 95% of developers say they enjoy coding more with GitHub Copilot. Another 90% of developers say GitHub Copilot makes them feel more fulfilled at work. In other words, the satisfaction level when using GitHub Copilot clearly highlights why the tool could hit the target numbers.
- Between 60% and 75% of developers report feeling more fulfilled when using Copilot.
- 74% of developers spend more time on higher-value work.
- 70% of developers report reduced mental effort while coding.
- 59% of developers report less frustration while coding.
- 60% of developers report greater job satisfaction.
- 51% of developers rate GitHub Copilot as extremely useful.
GitHub Copilot Company Case Study Statistics
We have two big names with high brand value that have been the champions of GitHub Copilot usage. And the numbers from the case study tell a pretty compelling story. For Duolingo with GitHub Copilot, experienced engineers became 10% faster. Whereas Accenture registered a 96% success rate with initial usage and productivity.
Duolingo
- New engineers became 25% faster when working in unfamiliar codebases.
- Median code review turnaround time dropped by 67%.
- Pull request volume increased by 70%.
Accenture
- More than 80% of developers successfully adopted GitHub Copilot.
- 67% of developers used Copilot at least five days per week.
- Pull requests increased by 8.69%.
- Pull request merge rates improved by 15%.
- Successful builds increased by 84%.
GitHub Copilot Security Statistics
Well, to sum it all up, the GitHub Copilot venture seems like an excellent addition to a space that needed more accessible solutions. With its introduction, things have become more productive, faster, and most importantly, well-managed. However, like any other setup, it comes with its own security concerns. Researchers identified vulnerabilities across 43 Common Weakness Enumeration categories. Here’s a quick look:
- 29.1% of GitHub Copilot-generated Python code contains potential security weaknesses.
- 24.2% of JavaScript code generated by the tool triggers security concerns.
- Repositories using Copilot show a 6.4% secret leakage rate.
- Secret leakage across all repositories averages 4.6%.
Sources:
- Companies History.com
- Worklytics
- Panto AI
- Quantumrun
- Tenet Global
- Secondtalent
- AI Business Weekly
- Cornell University
- GitGuardian
Final Verdict: Is GitHub Copilot Worth the Hype in 2026?
With GitHub, the tension is visible and keeps lingering in conversations. The productivity gains are real, but so are the security concerns. The 6.4% secret leakage rate is not a good enough reason to think twice.
Think of it like driving a fast car. You simply do not stop using the car for a bad road, but you learn your way around it.
The numbers here are clear: 20 million users, 90% of Fortune 100 companies, and over $1 billion in ARR do not happen by fluke. The thing is, GitHub Copilot did not just change how developers write code. It changed what writing code even means. Therefore, the only real question left is not whether to use it, but whether you can afford to miss out on it.